
SellerApp’s Analysis of Black Friday 2020
The busiest shopping day of the year, Black Friday is finally over. With most people turning to digital shopping, they frantically thronged e-stores for the best deals. Within the first ten hours, shoppers spent over $640 million on online sales alone, a huge 18.4% jump from the previous years, according to a survey by Adobe Analytics. Each of the first 22 days of November rung up over $1 billion in revenue. Amazon alone took an ‘eye-popping’ 45-50% of the total e-commerce dollars from the frenzied Black Friday sales.
Amazon Black Friday sales was a much bigger game this year and saw the sales rocket through the roof. Amazon Black Friday and the rest of the holiday shopping season is often the make or break period of the year for Amazon sellers. Regardless of what you think of all the hype, retailers really do rake in a lot of money around the holidays. Most Amazon Sellers saw their stocks go empty within minutes.
BLACK FRIDAY SALES DATA STATISTICS
Physical Stores traffic

Black Friday sale breaks its records each year. Even as online stores saw a huge hike in sales, people kept to tradition and headed off to the malls in person. This year, there were 120 million people who braved the crowds, 19 million more than the previous year and a whopping 46 million more than the year before.
If you think Amazon sellers only have a fixed opportunity field wait till you hear the statistics. Each year sees a huge hike in the number of people shopping during the holiday season.
Shopping Statistics
There has been a steady growth since 2012 in the amount of money spent by each shopper. Compared to 2016, there has been a 0.4% increase, in other words, each shopper spent about $935.58 and in 2017, each shopper spent $967.13. Total spending this year was $682 billion!
We have rounded up the categories that offered the most discounted deals so that you can keep a check of what exactly happened.
Most Discounted Categories
Top 5 categories of 2017 Black Friday were Toys & Games, Home, Electronics, Computer & Tablets, and Clothing. Want to sell in these categories? Be prepared to give huge discounts. Since it is the holiday season, these products sell like hotcakes. The sales will even the discounts and you can still take a huge chunk of money home.
PS: It was the Philadelphia Police Department who formulated the phrase - Black Friday - to describe the Chaos surrounding the congestion of pedestrian and auto traffic in the downtown area.
Merchants with Max Discounts
Black Friday 2017 also saw other big players offer huge discounts to lure their shoppers. Sellers who sold on these platforms other than Amazon also made huge profits and sales.
For sellers, it is always a good idea to send a part of your inventory to these platforms along with offering them on Amazon. More reach is better sales, isn’t it?
E-commerce business is just getting bigger and bigger with Amazon. With more people turning to digital shopping, Amazon Sellers are the best benefitted. With easy access and the most lucrative deals, the holiday season brings the most traffic to the Amazon store.
These strong sales are also a positive sign for you to start selling on Amazon. Wait but doesn't Amazon already have so many sellers? Can you stand the competition? Definitely yes, the number of Amazon sellers is increasing each passing year however, there is still a lot of room left to comfortably carve a profitable business by selling on Amazon.
You can get it all right and be smashing if you are able to get the first decision correct, the right product to sell. However, it is inevitable that the competition is only going to see an increase each year. With so many sellers already dominating the all the categories, it is a little of a task to narrow down a money-making product with ease.
Black Friday Sales Statistics
- We have put together a list of the top 1k products that are expected to make the best sales this holiday season. Our team has already shared a list of potential best sellers. With the list, finding out a profitable product idea cannot get simpler.
- Also, we analyzed the top 5k products that sold the most on Black Friday to get a better understanding the categories a Seller can target. It also offers a great insight into the sales and profits you could make. And importantly the standards that the top sellers have already set. Excited already?
- Let's dig straight into the data and probe the secrets behind the bestseller products. We‘ll also take a look at the top 5 Black Friday 2017 categories and the top 5 sellers in each of the categories to understand the profitability of the niche.
- TOYS & GAMES
- Home & Improvement
- Electronics
- Computers & Tablets
- Clothing
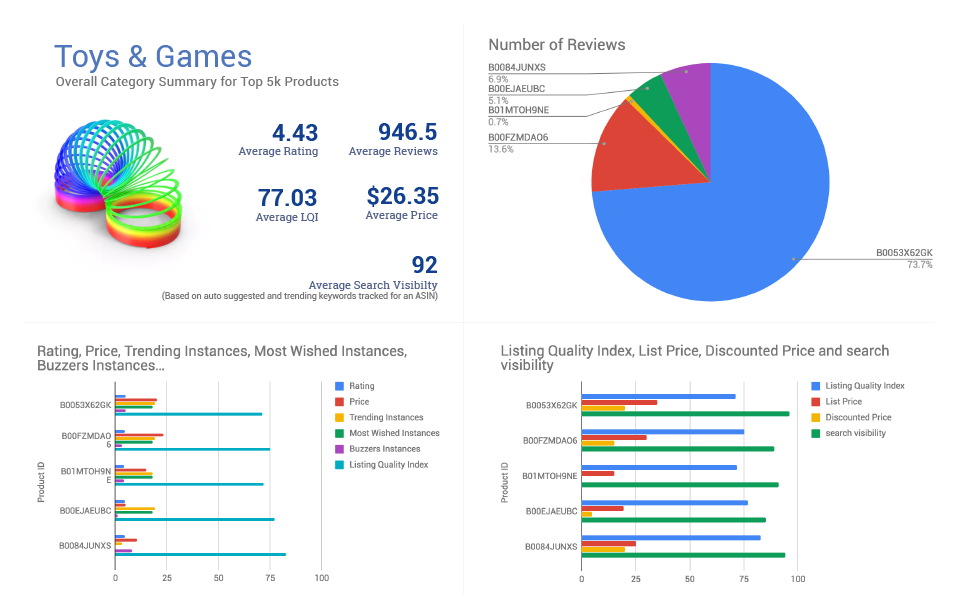
The average rating and number of reviews give you an idea of the competition and the standard that has to be met to rank in these categories.
The LQI or the listing quality index explains how good the quality of a listing is and the search visibility explains the product visibility in Amazon search results for most of its keywords.
This can be a very clear insight into how difficult it is to crawl and make your space in the niche. A very high visibility and LQI means that you will also have to clearly and effectively strategize your keywords and listings to get to the top.
Want to rank at the top in these categories? The rest of the data are directly related to the top 5 products in the niche. Analysing these products give you a better insight into bringing more sales and the contest to rank better.
The number of reviews as said before is proportional to the sales volume of the product and related to the standard that is set by these products. A product with more reviews will see more sales in the future as well. If a product comparatively has a huge number of reviews than the remaining, you can expect to face very stiff competition from the product. However if it seems to have an equalized divide in the reviews it can be easier to get into the niche, as there will not be much of a big battle from a single product in particular.
The instances show the number of times the product has ranked in 4 different categories - Buzzers, Most wished and Trending. Buzzers are products whose BSR has recently improved significantly, Trending products are products that are currently trending on Amazon, Most wished products are the most gifted and products added to wishlists and registries on Amazon.
If a product appears multiple times in any of the said categories, then we can safely assume that the products are doing something right, it could be in terms of organic demand or optimizing sales by giving out promotions, discounts or other strategies to sell more.
Optimizing sales comes down to three factors. Listing quality (LQI), price and search visibility. Observing these three factors will give a clear peek into their strategies. If an ASIN ranks above average for any of these factors, it clearly signals its competitive advantage over the other sellers. An optimal mix of these three factors can clearly determine who rules the niche.
How to make use of this list?
The next big selling season will be here…….. before you even know it.
Make the most out of it starting today. The list is a very good compilation of product ideas for Amazon Sales. You can improvise on these products, take inspirations for your Amazon product launch, understand top sellers strategies and make it your own. Connect the dots to gear up. With SellerApp by your side, you are all set to succeed. Make informed data-backed decisions, get quality insights.
Here’s how you can take the best advantage of this list of clear winners.
Research the product idea
Not all products can be sold successfully by everyone. Demand, Sales, market trends and a lot of other critical data should be taken into account to zero in a best selling product.
And how do you do this? Research and research to gather all the critical data. Product Research makes things much simpler. All the critical data including estimated sales, profits, product potential in one single click.
Gauge the competition
Track your competitors. Identify their business strategies. Gather all their data with Seller Watch feature. Keep yourself informed and get notified. Easy alerts for pricing, listing, and track the products with Seller Watch. Get a list of all their current Amazon products and alerted on their upcoming product releases. Once you track products you get information that looks like this.
Rank the best for the most keywords.
You may uncover a product opportunity that you can dominate with little or no competition. However, your amazing product will remain in the shelves if you cannot get it upfront and shining in a search. Keywords have the power to make or break your Amazon Sales. A product in the first page sells 10x times more than a product in the second page. Bet your most on keywords that strike a good balance of high search volume and less competition.
With the keyword Research tool, pull in all the relevant keywords to become an Amazon best seller. Shortlist among Amazon auto suggested keywords, trending keywords. Did you know that SellerApp’s keyword tool even gives you the top selling products for each keyword?
Sieve the best keywords with the Keyword Tracker.
Keyword tracking ensures that you don’t lose your sales for your top keywords. Helps you decide the right pricing and PPC strategy to gain top ranking for the keywords. A product that is in page 1 will have 3-10x the sales of a product that is in page 2. So it is quite important to realise that you need to be on page 1 for your top keywords. This can be automated completely with SellerApp.
Track Amazon page rank to monitor your keyword performance and number of products indexed on Amazon to track competition over time for each keyword.
Still Not Convinced?
See how you can strike the perfect sales and profit mix on just one platform
Glossary
| Listing Quality Index(LQI) | LQI is a gauge of the quality of an Amazon product listing based on 7 parameters. Keywords, images, bullet points, description, fulfillment mode, reviews and ratings are compared against Amazon’s recommended standard and given an aggregate score. A good score would be anything above 80, average would be between 60 and 80, anything below 60 would need attention |
|---|---|
| Search Visibility | Product visibility in Amazon search results for all the relevant Amazon suggested keywords and trendings keywords |
| Trending products | Products that are currently trending on Amazon |
| Buzzers | Products whose BSR has recently improved significantly |
| Most wished products | Most gifted products and products added to wishlists and registries on Amazon |